Kubeshark Live Demo Walkthrough
Have you ever been curious about Kubeshark but lacked the necessary Kubernetes cluster to try it out? The Kubeshark live demo provides a comprehensive platform to explore a wide array of features without any setup prerequisites. This guide aims to walk you through the demo, highlighting key functionalities and how to access them.
Summary of Demonstrated Features
- Secure Self-hosted Deployment with Ingress, TLS, and SAML
- Real-time API Traffic Visibility
- HTTP, REST, gRPC, GraphQL, WebSocket, Redis, RabbitMQ, Kafka, and DNS
- Encrypted Traffic (TLS)
- Network Error Detection & Analysis
- Identity-aware Service Map
- Inspect Performance KPIs for Pods, Services, Nodes, and Namespaces
- Rich Query Language
- Default Filter
- Share or Store the Specific Filter
- Sensitive Data Redaction
- Dashboard Mode
- Authorization Rules
Getting Started
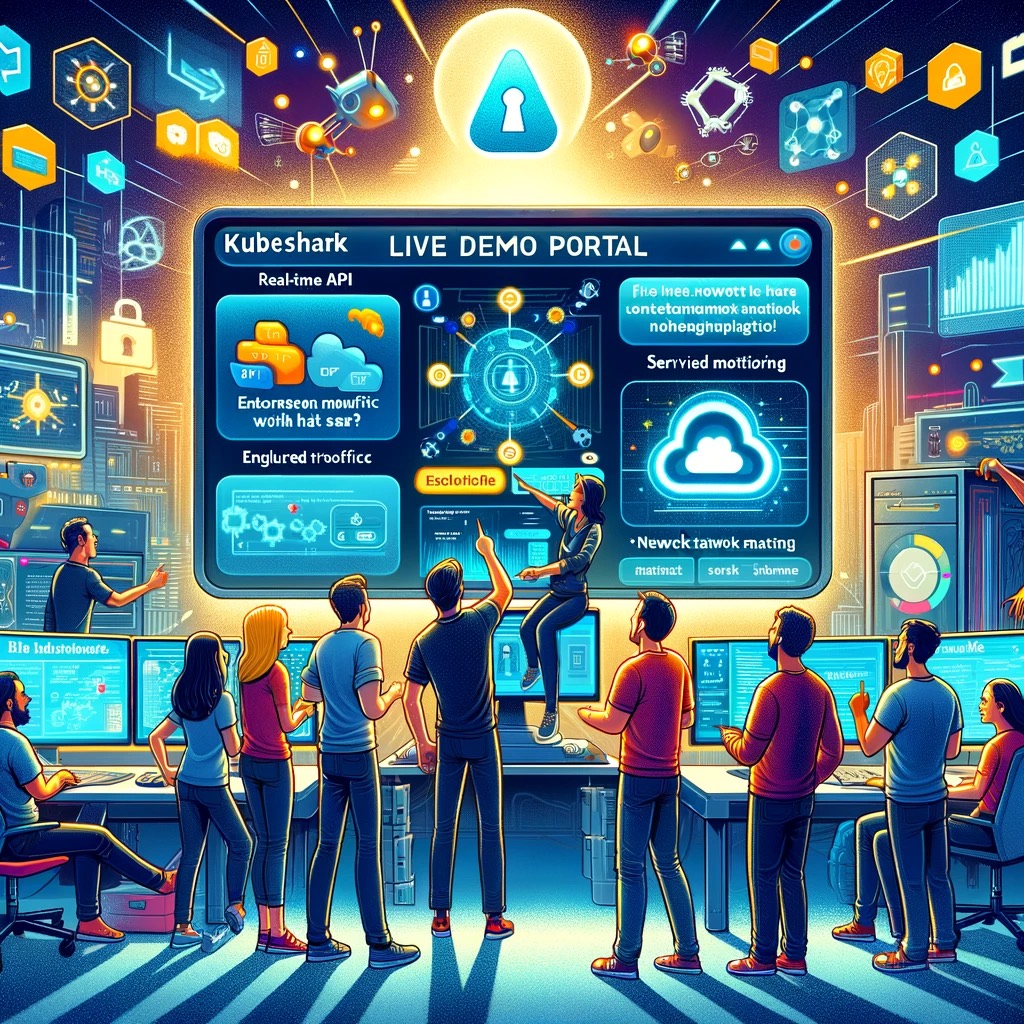
Accessing the demo is straightforward. Visit the demo portal at https://demo.kubeshark.co/ and either sign up for a new account or log in if you're already a Kubeshark user.
Secure Self-hosted Deployment with Ingress, TLS, and SAML
Description
This demo portal showcases a self-hosted deployment of Kubeshark utilizing Ingress, TLS, and SAML. It enables all developers in your organization to view real-time traffic, authenticated and authorized by the organization's IDP using SAML. Browser communication is encrypted, and no kubectl access is required to view real-time traffic.
How to Experience This Feature
Simply sign up or log in to the demo portal.
Learn mode in the docs' Ingress and SAML sections
Real-time API Traffic Visibility
Description
Think of Kubeshark as Wireshark re-invented for Kubernetes (K8s). It provides SREs and DevOps teams with instant and unique insights, previously unattainable, accelerating the diagnosis and resolution of production incidents.
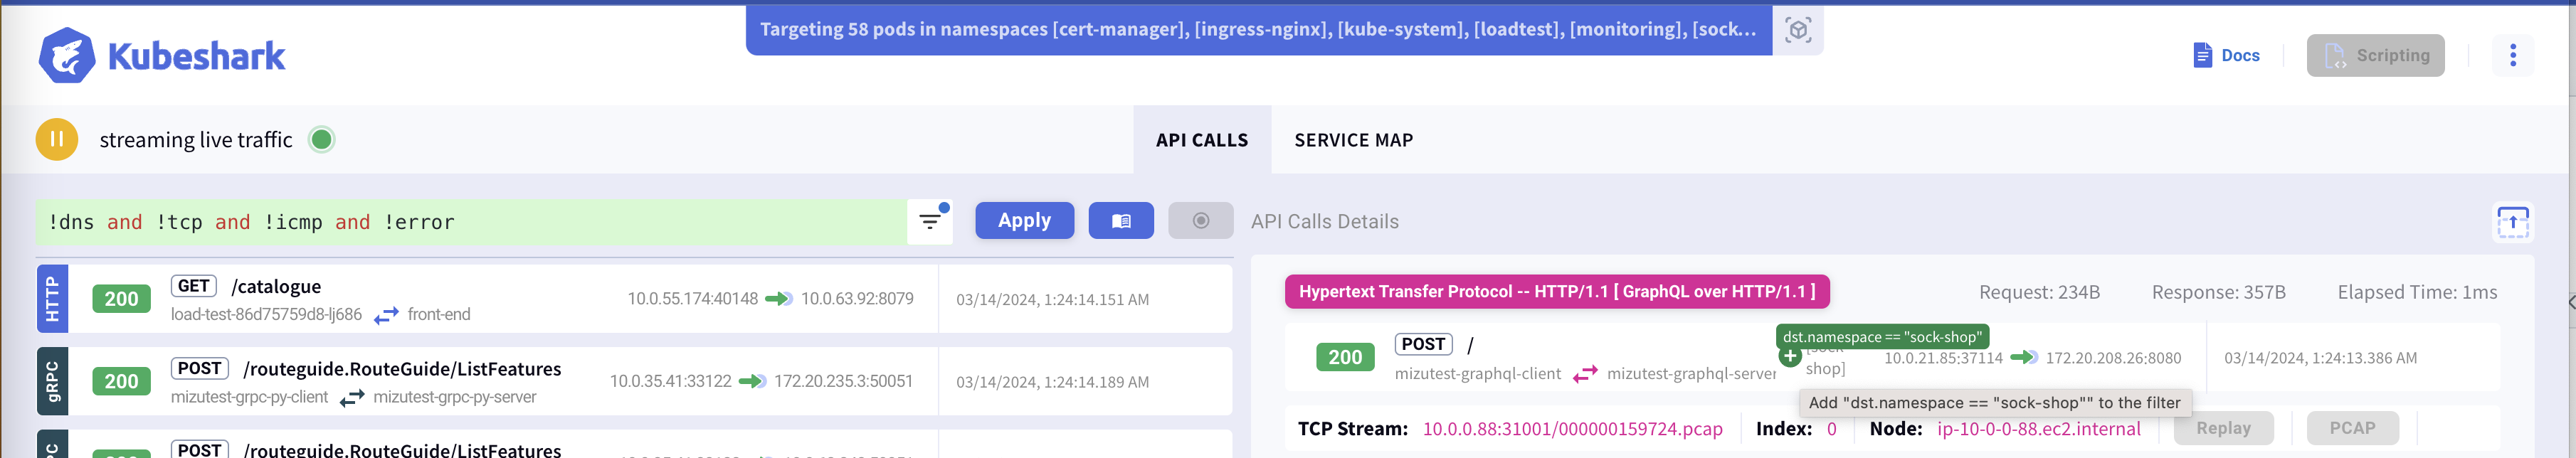
Kubeshark offers real-time, cluster-wide, identity-aware, protocol-level visibility into API traffic, allowing users to see what’s happening in all corners of their K8s clusters.
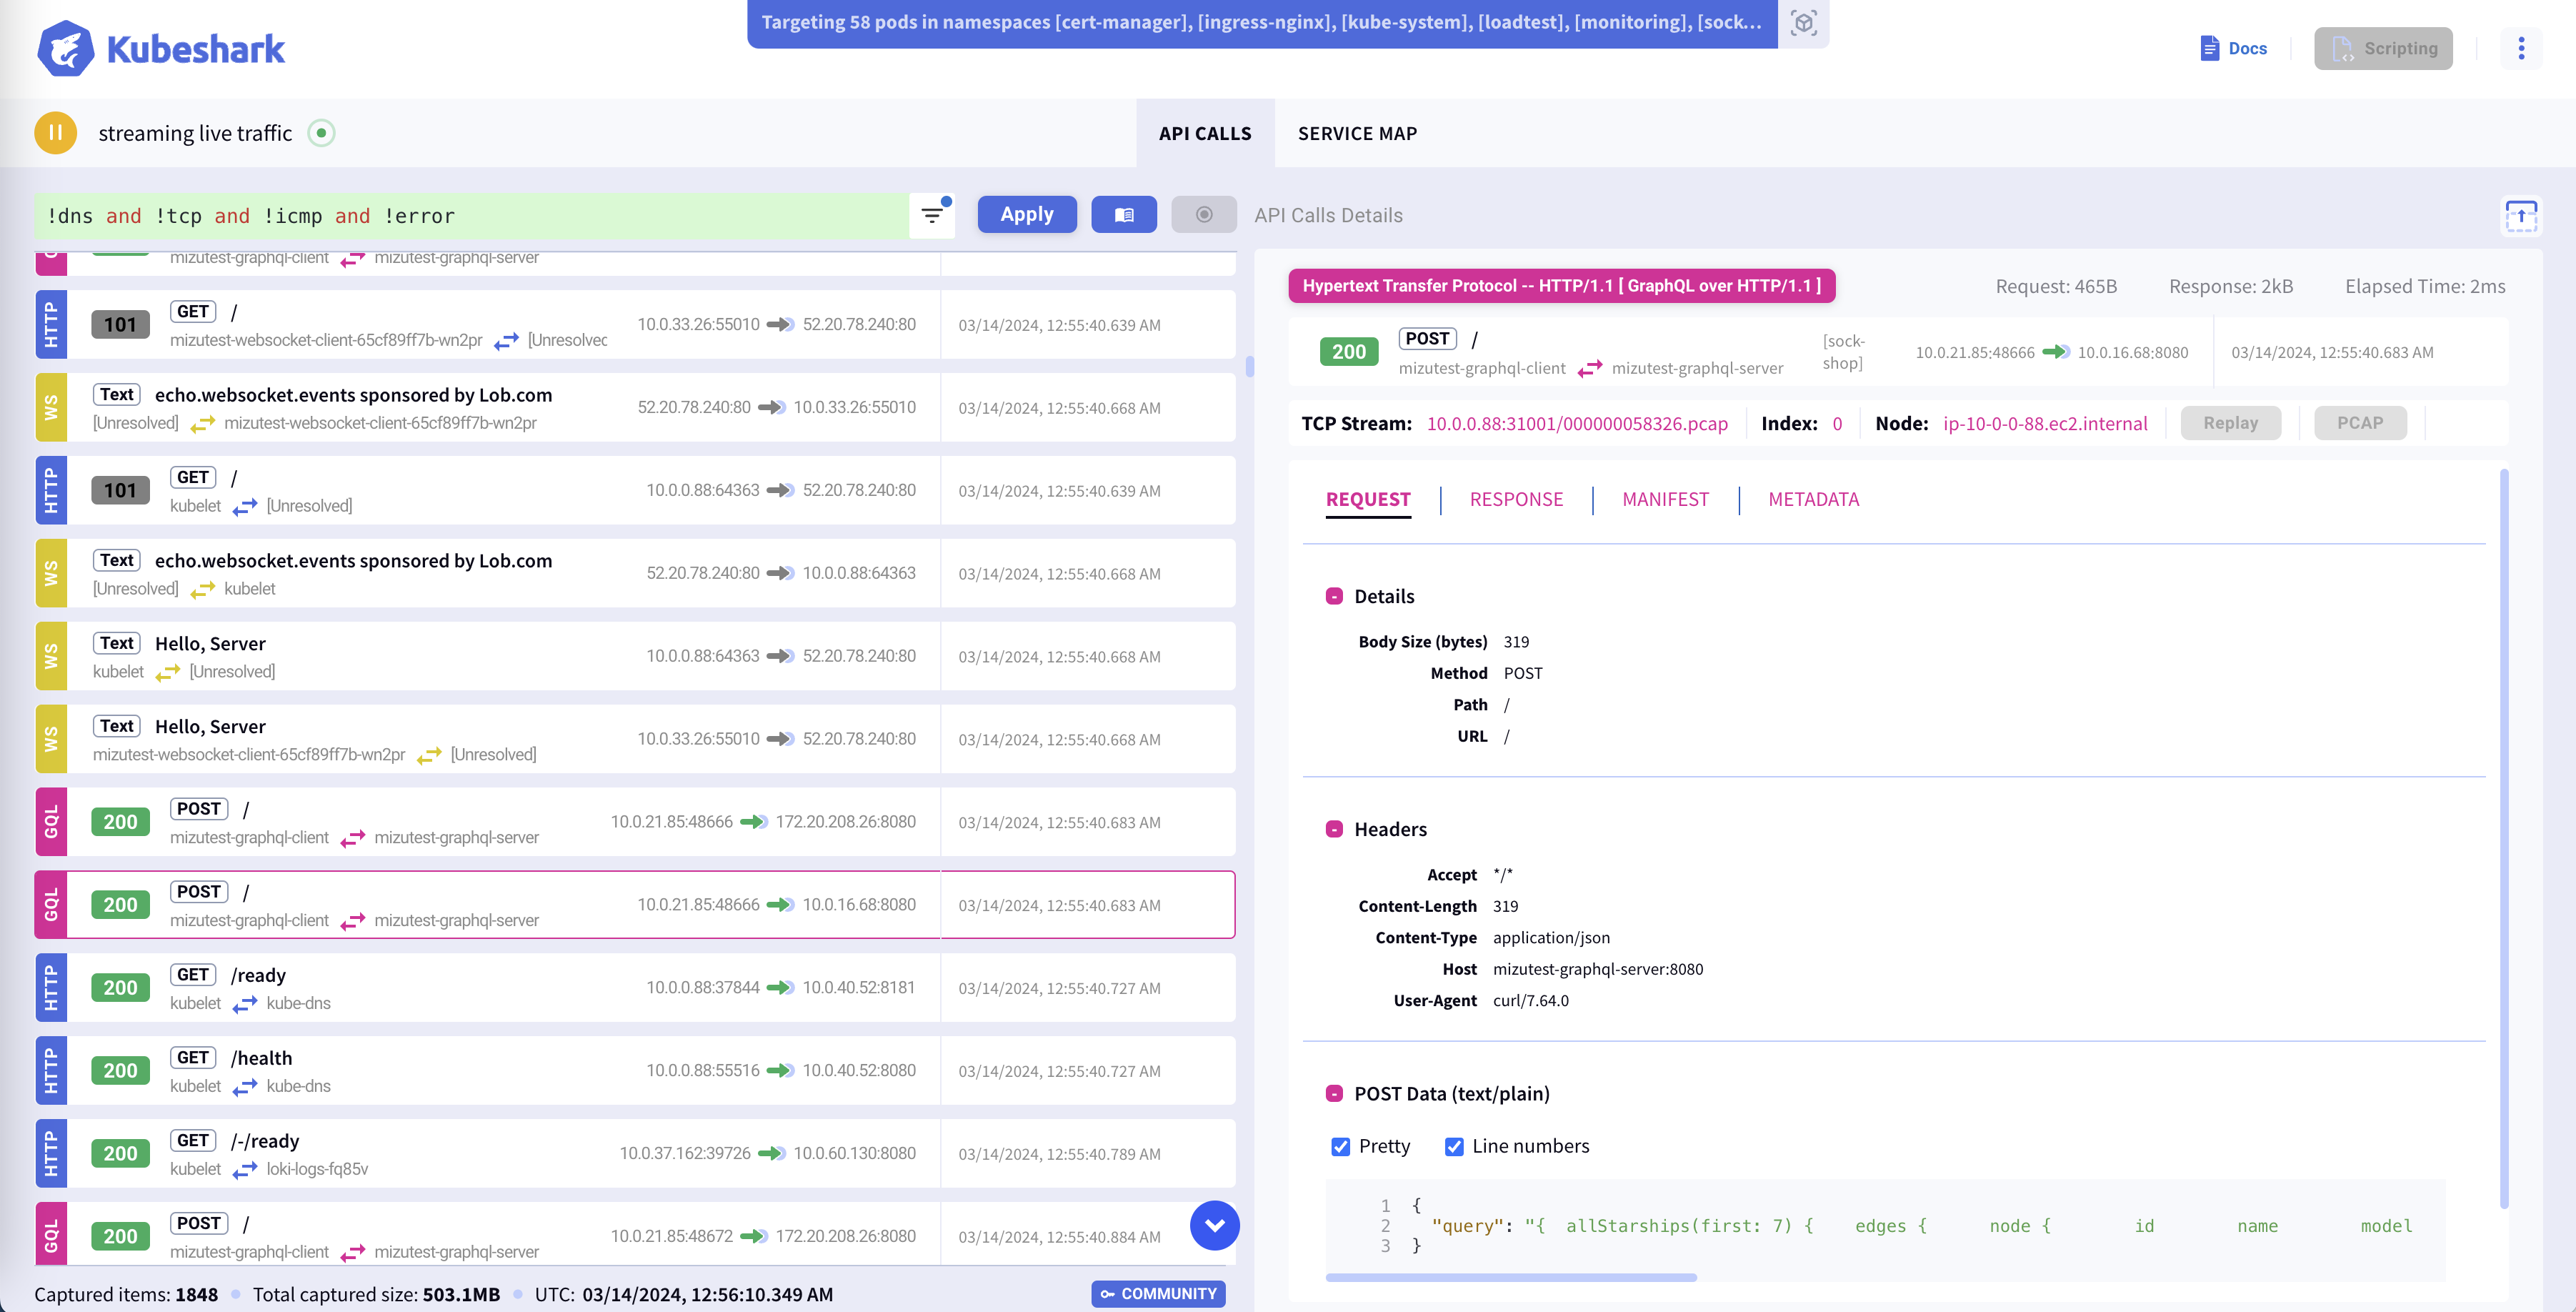
Left Pane - Real-time Traffic Streaming
The left pane visualizes real-time streaming traffic with a summary for each API transaction. Summarized details include the protocol, method, path, source and destination pod names, IPs, and ports.
Left Pane - Detailed API Transaction Metadata
Selecting each traffic entry on the left reveals a detailed view of the API transaction's request and response, in addition to K8s manifest information and complete API call metadata, on the right pane.
How to Experience This Feature
Once signed into the demo portal, you'll see traffic streaming in real-time.
HTTP, REST, gRPC, GraphQL, WebSocket, Redis, RabbitMQ, Kafka, and DNS
Description
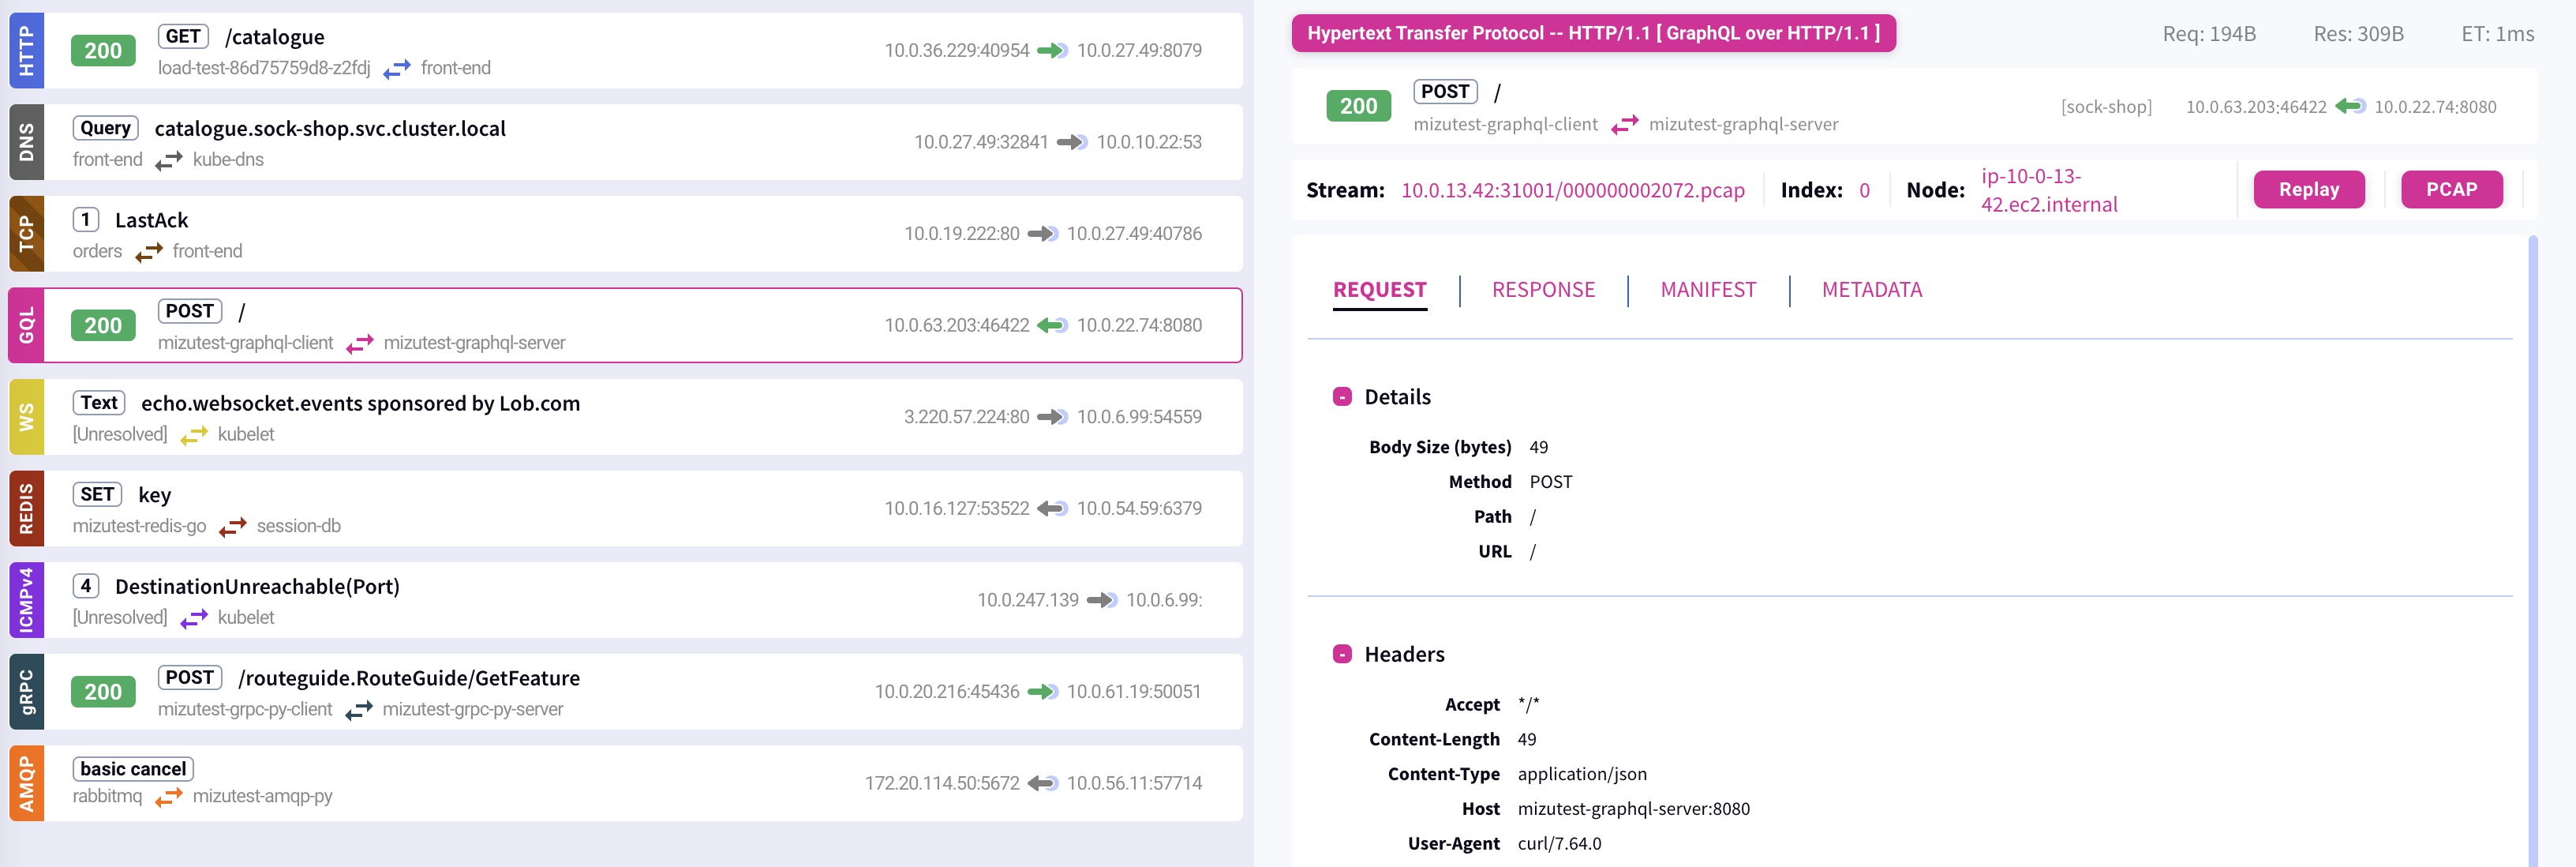
Observe all traffic, including payloads, as it enters, exits, and traverses containers, pods, namespaces, nodes, and clusters, with support for a variety of protocols. The streaming traffic is differentiated by color, with each protocol having its unique color.
How to Experience This Feature
Feel free to stop the streaming and inspect the traffic entries.
Encrypted Traffic (TLS)
Description
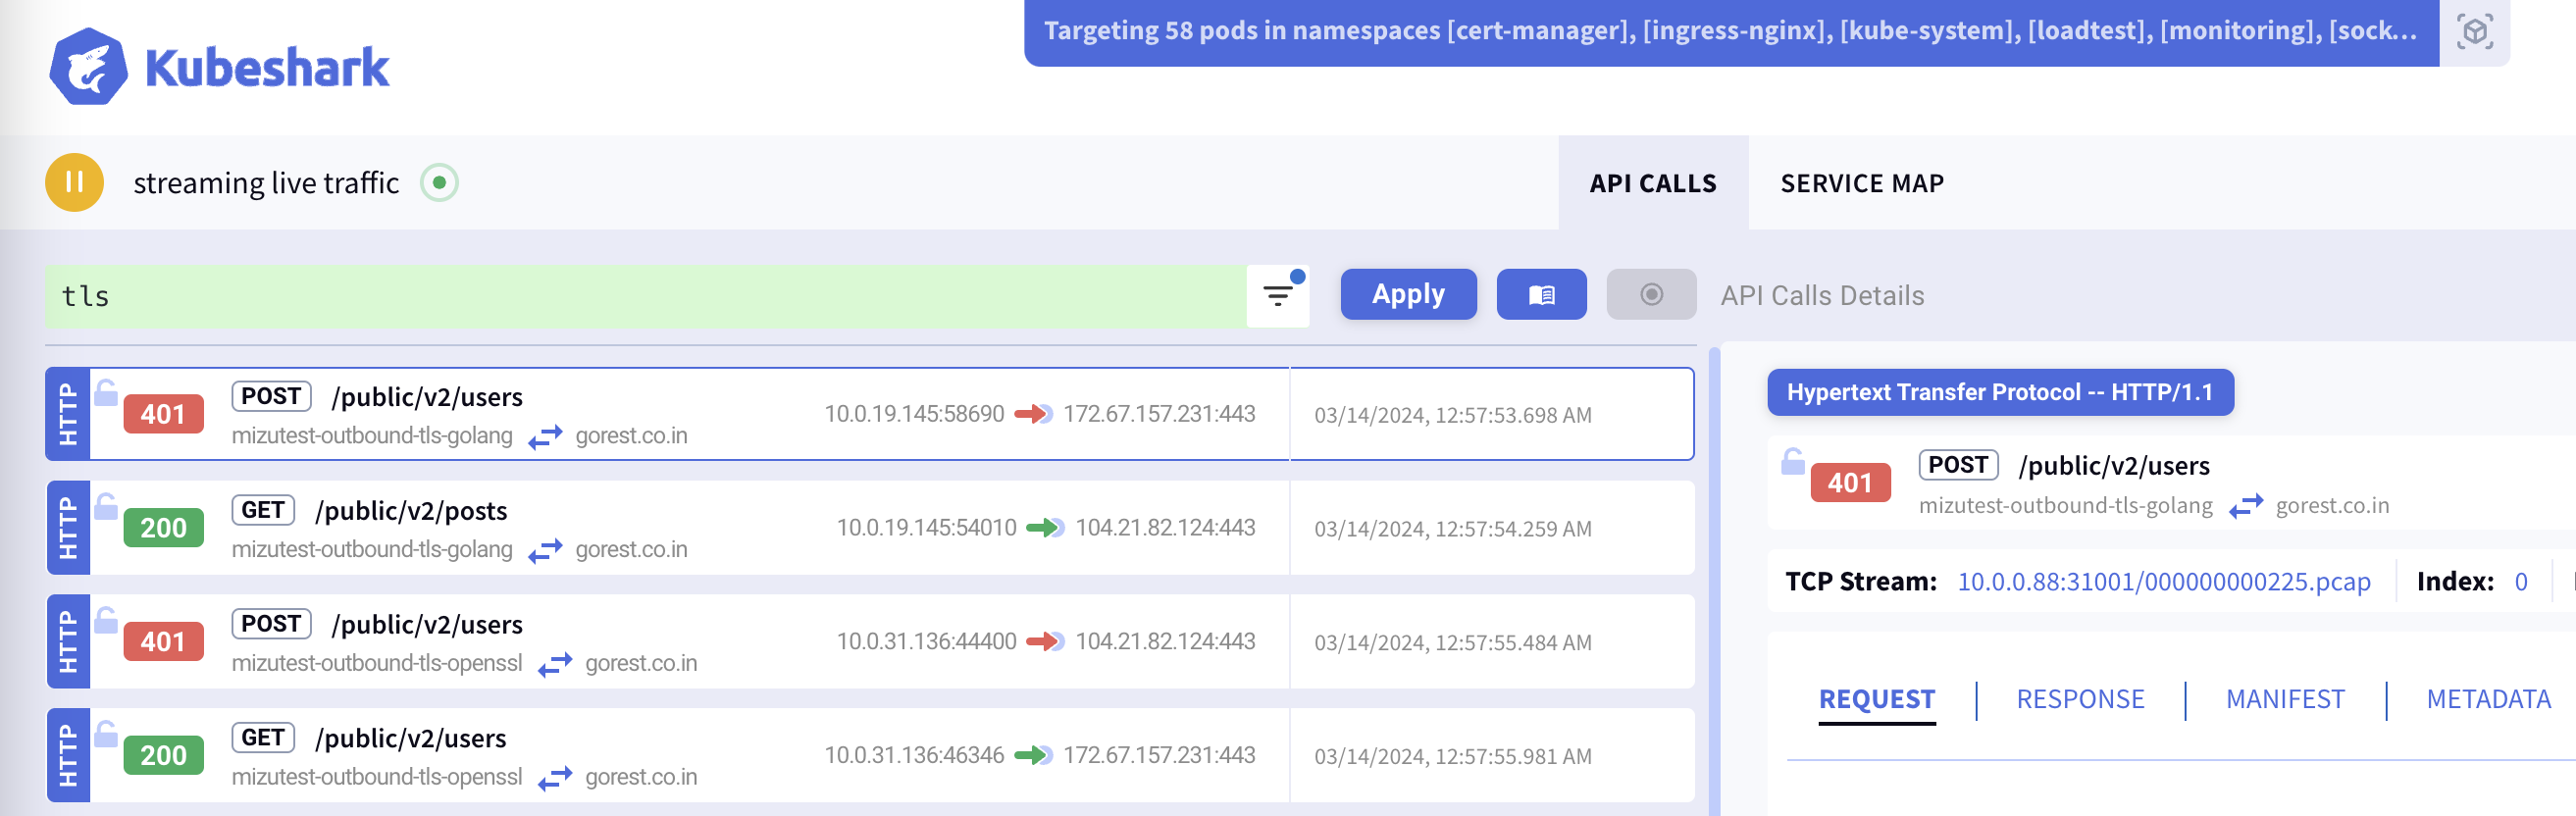
Kubeshark can monitor encrypted traffic (TLS) in your cluster using eBPF without decrypting it. It provides tracing for kernel-space and user-space functions, offering insights into TLS traffic marked with an open lock icon.
How to Experience This Feature
Replace the content in the KFL box with tls to view entries identified with a lock icon, representing encrypted traffic entries.
Learn more in the docs' eBPF section
Network Error Detection & Analysis
Description
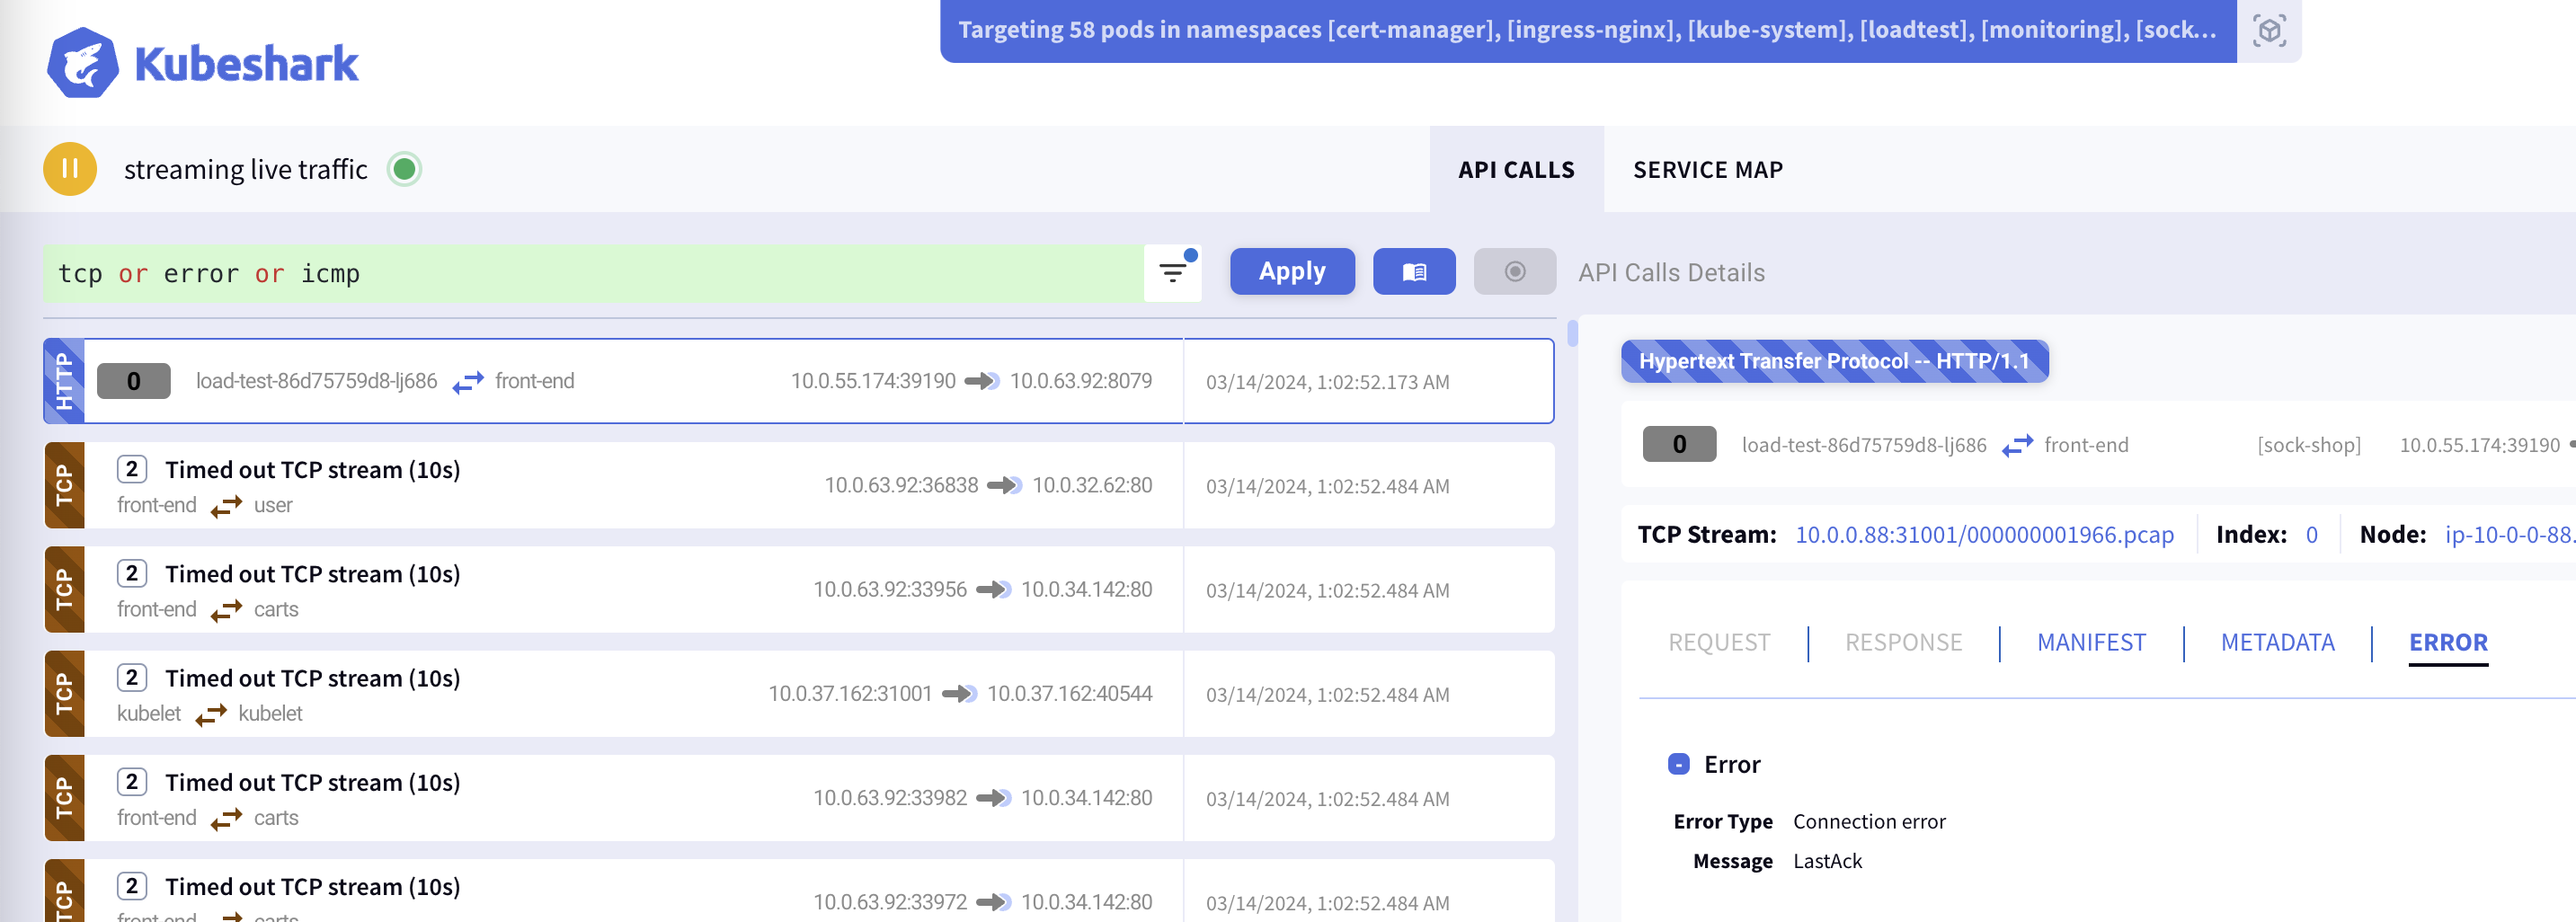
Kubeshark analyzes TCP and ICMP protocols, leverages eBPF, and applies internal logic to diagnose network-related errors effectively.
A partial list of the errors that can be detected includes SynSent, CloseWait, LastAck, Reset, packet loss, timeouts, premature closure, Network Unreachable, Host Unreachable, Protocol Unreachable, Port Unreachable, Fragmentation Needed and DF (Don’t Fragment) set, Source Route Failed, Destination Network Unknown, Destination Host Unknown, Source Host Isolated, Network Administratively Prohibited, Host Administratively Prohibited, Network Unreachable for Type of Service, Host Unreachable for Type of Service, and many more.
How to Experience This Feature
Use KFL helpers like error, icmp, tcp, and statements such as response.status > 400 to view detected network errors in this deployment.
Learn more in the Network Error Detection & Analysis section
Identity-aware Service Map
Description
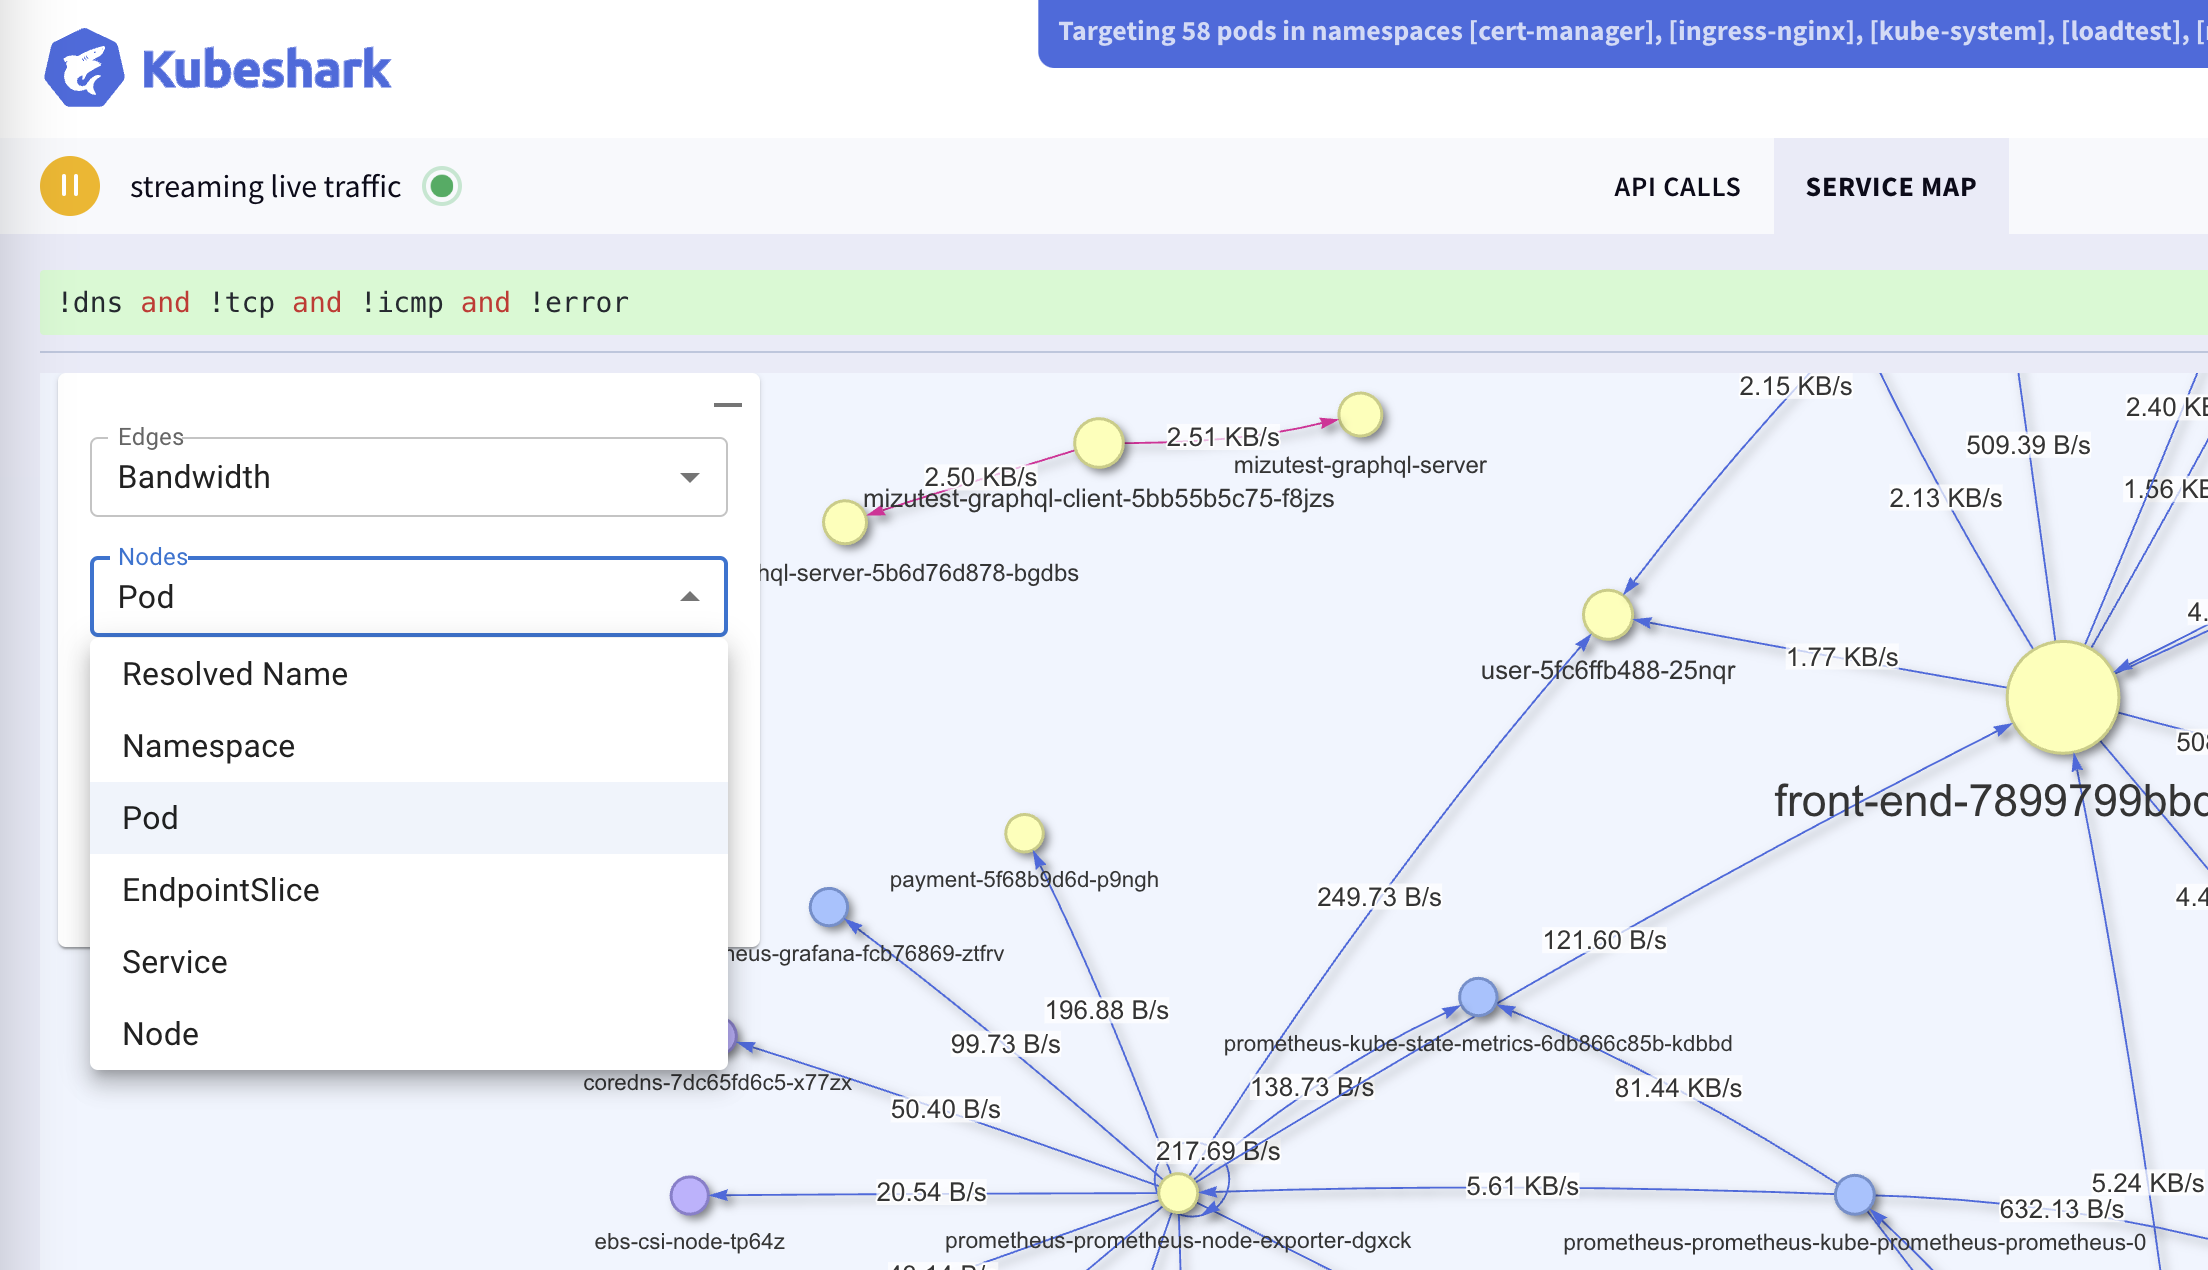
Toggle between service, pod, and namespace perspectives to monitor latency, bandwidth, and throughput. The service map updates in real-time and adheres to the KFL statement as well as the start/stop of streaming traffic.
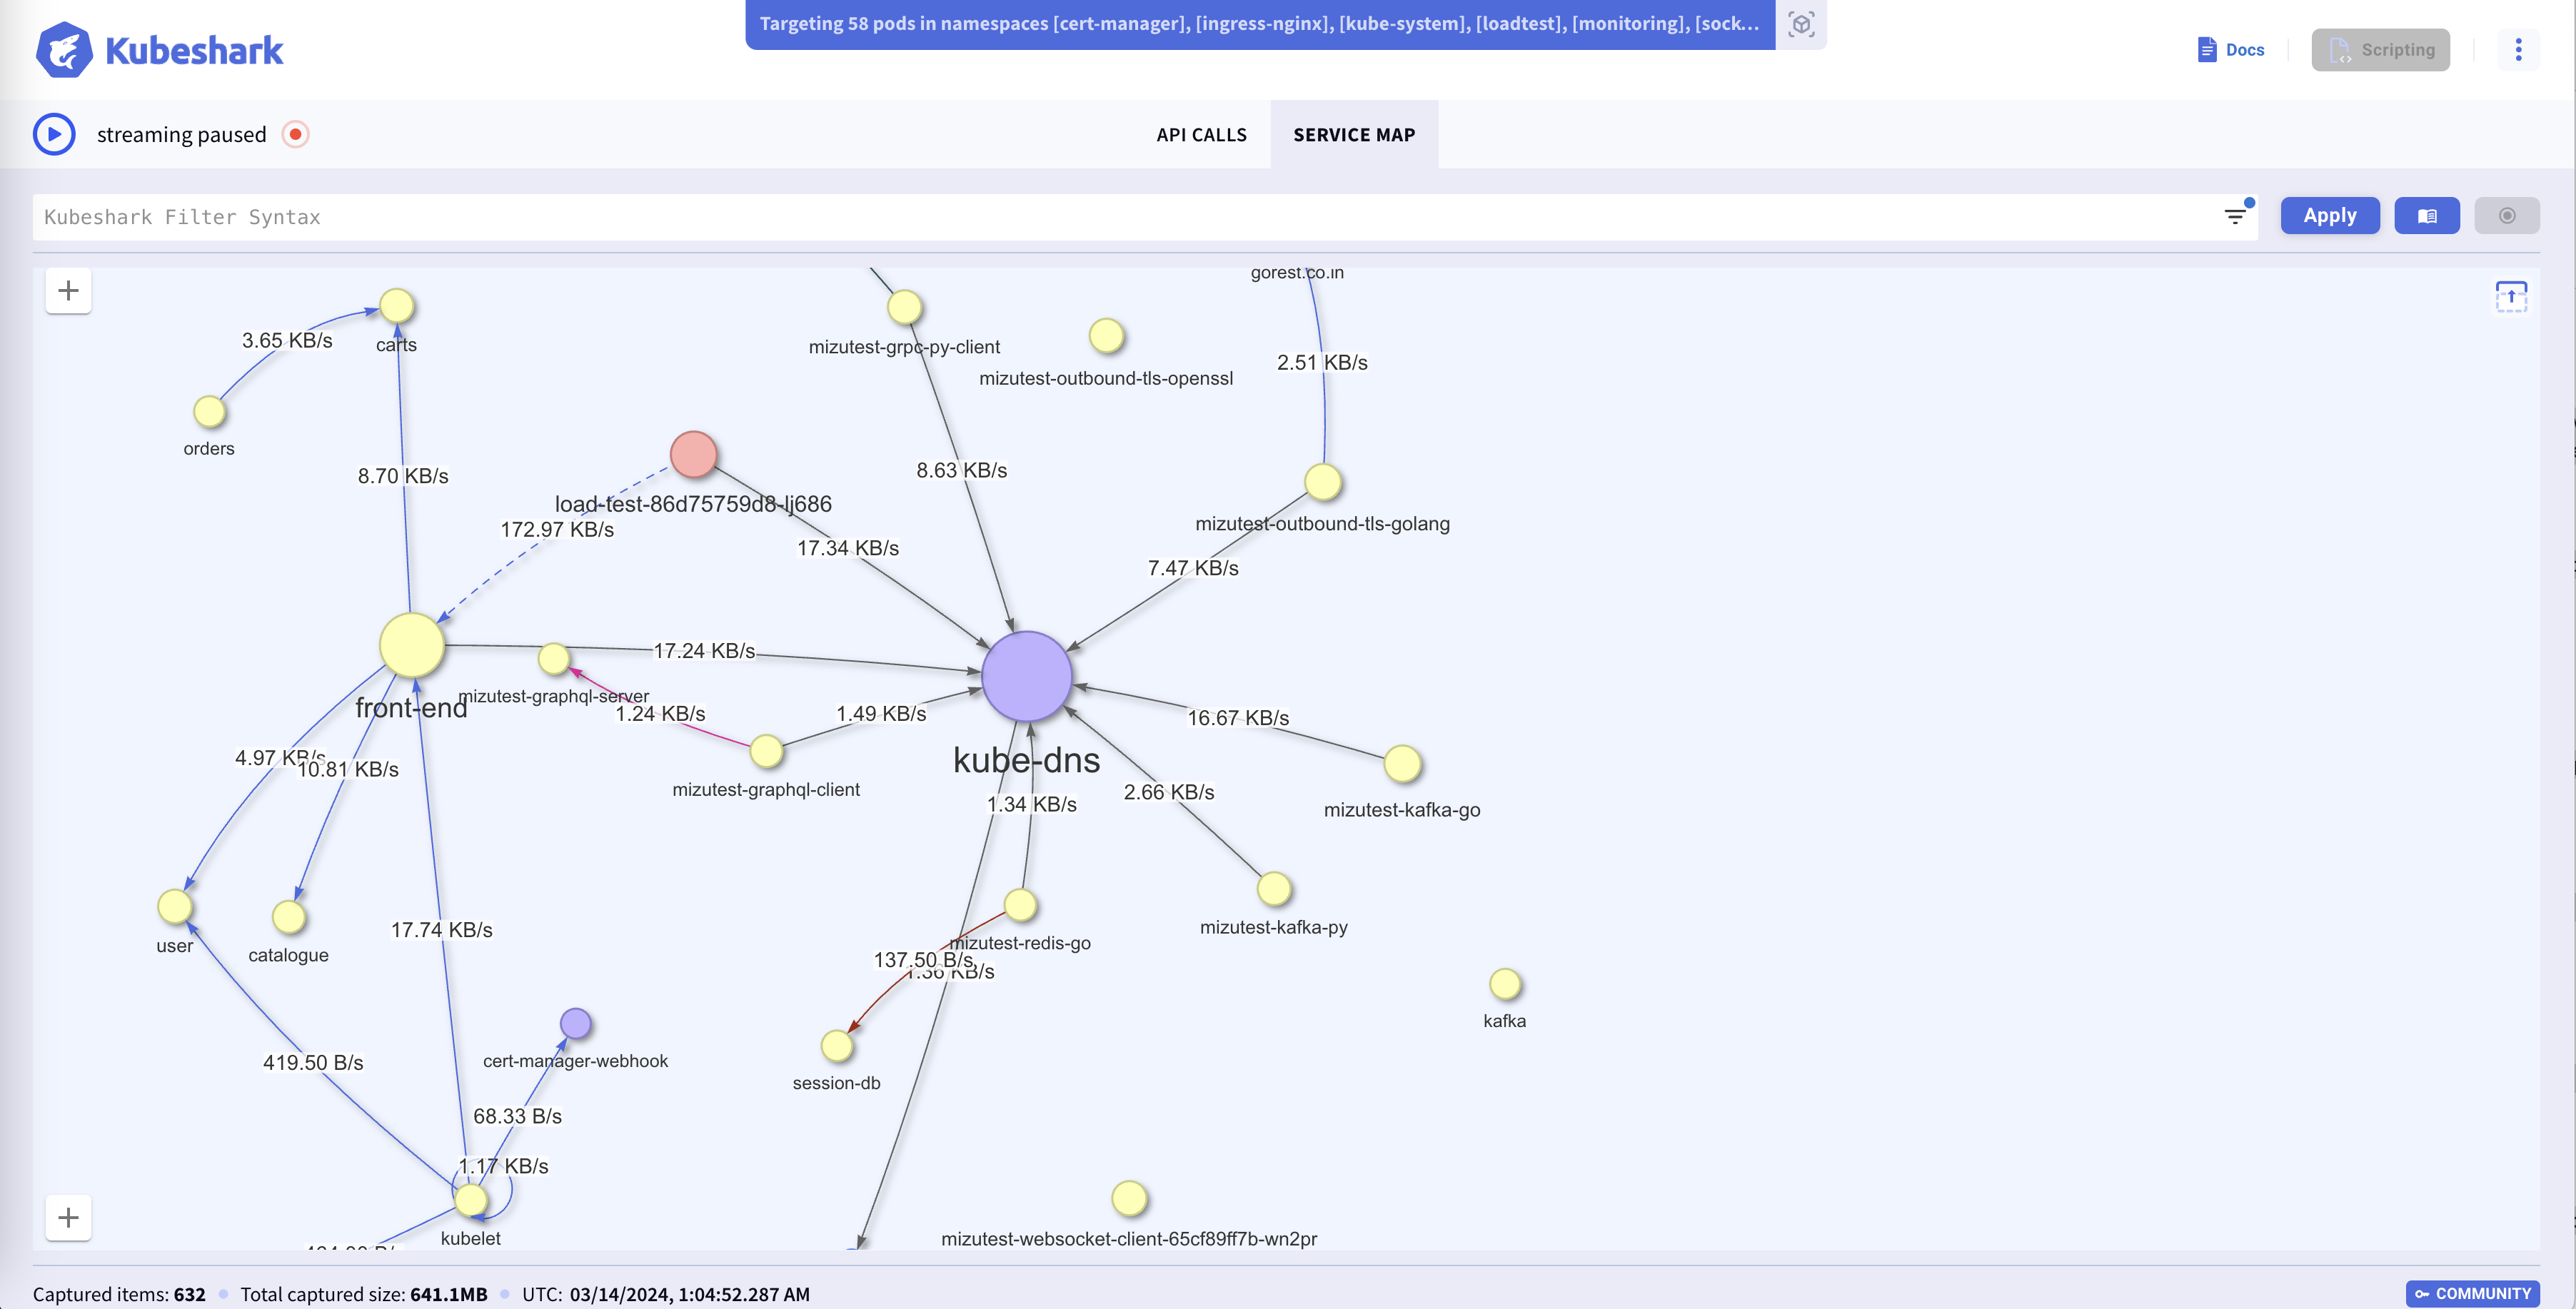
Use the Service Map feature to unravel the intricate web of relationships of a specific cluster segment described by a KFL entry.
How to Experience This Feature
Press the Service Map tab to view the identity-aware service map. To pause the service map building, stop streaming. Start streaming to continue updates.
Inspect Performance KPIs for Pods, Services, Nodes, and Namespaces
Description
The Service Map enables you to switch views between services, pods, namespaces, and nodes. It also enables you to view latency, throughput, and bandwidth between components.
Rich Query Language
Description
Kubeshark Filter Language (KFL) allows you to filter traffic that matches a boolean expression. Hover over UI elements with a green plus sign to add them to your query.
How to Experience This Feature
Select elements with a green plus sign to build your query and press apply to see the filtered results.
Default Filter
Description
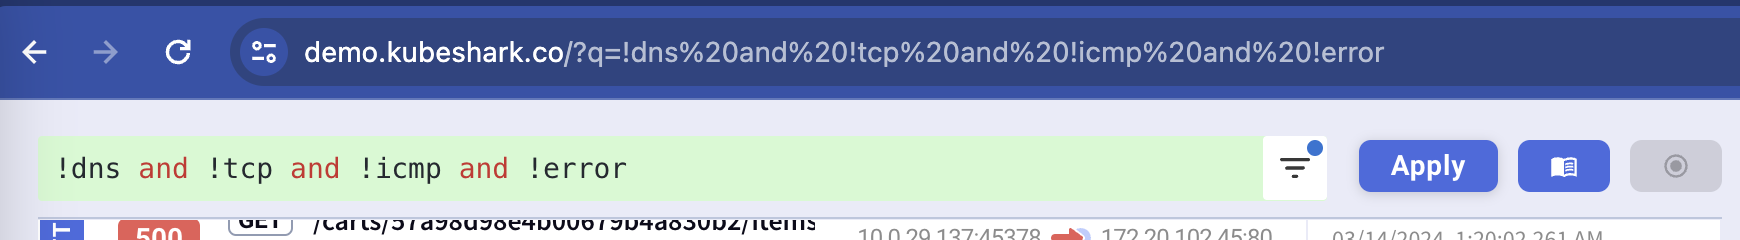
Upon launching, the dashboard initially presents itself with a pre-configured Kubeshark Filter Language (KFL) statement: !dns and !tcp and !icmp and !error. This filter, designed for optimal user experience, is fully customizable and will be automatically applied each time you access the dashboard's root URL.
As an example, by employing this default filter, the dashboard effectively excludes DNS, TCP, ICMP, and any traffic flagged as erroneous, ensuring a focused and relevant data visualization from the start.

Share or Store the Specific Filter
Description
Any filter is remembered in the URL. You can add it to your favorites or share with colleagues.
Sensitive Data Redaction
Description
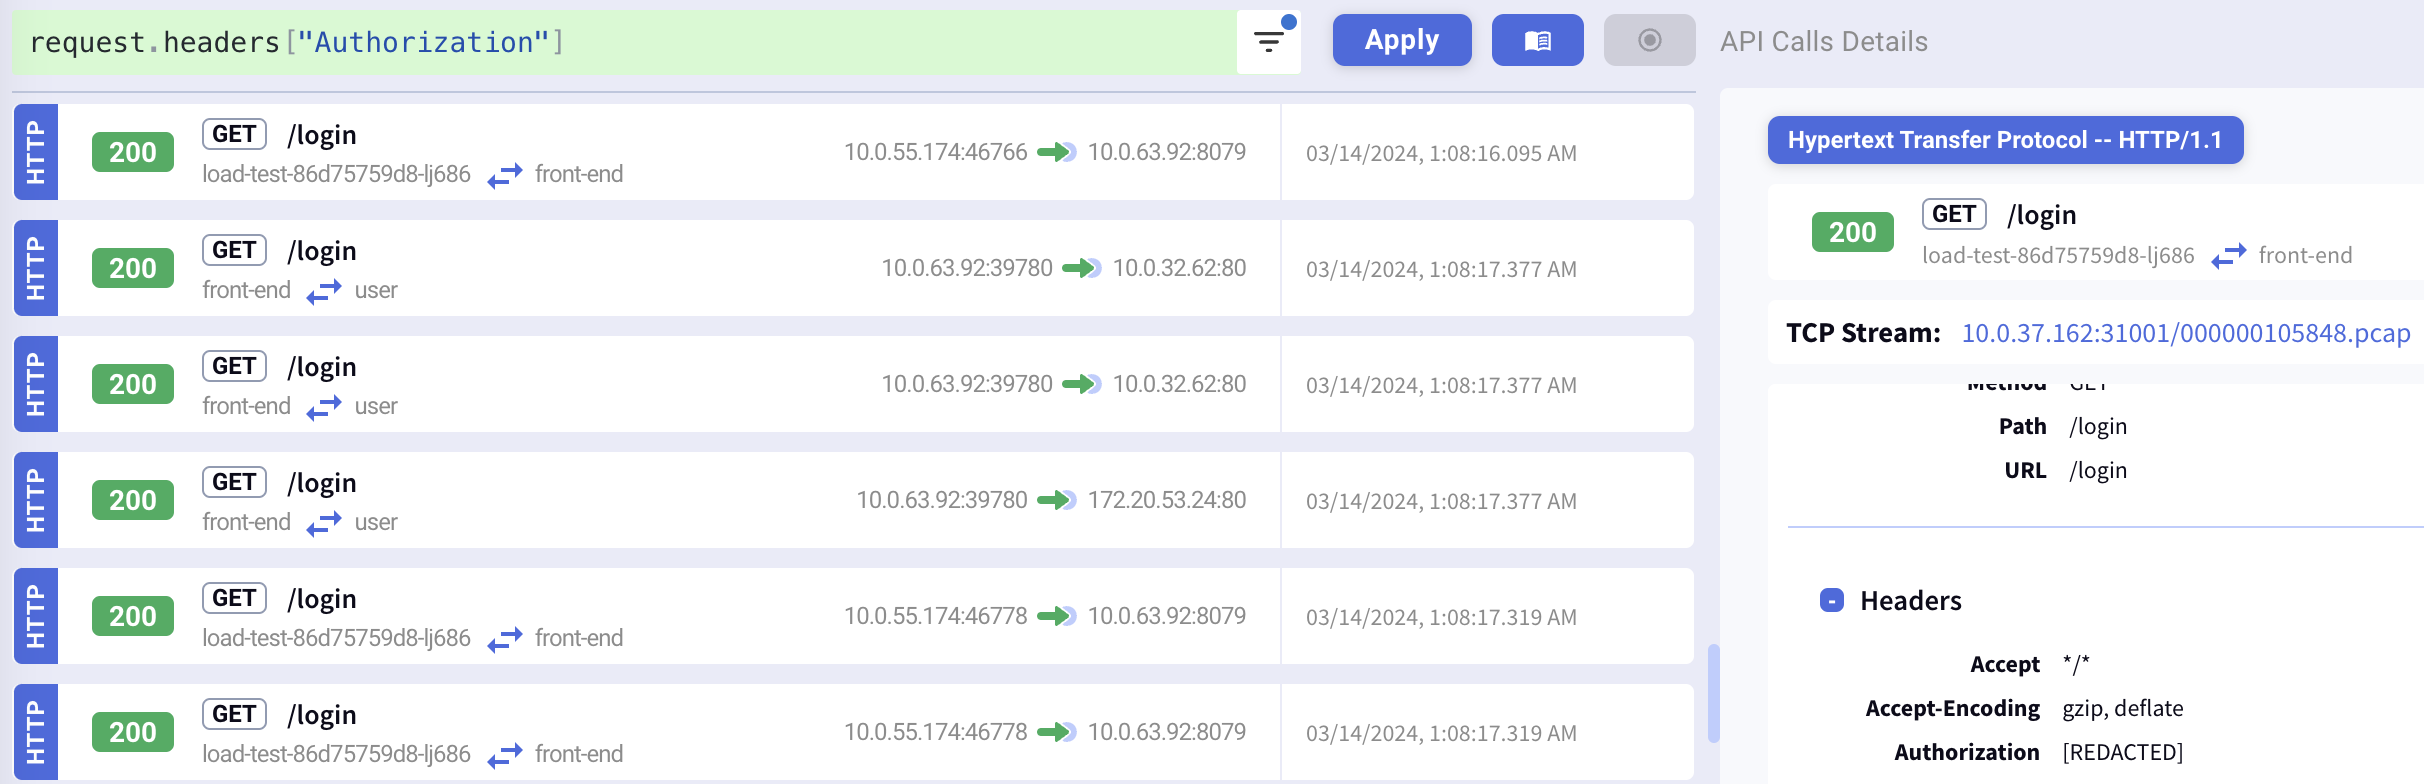
Sensitive data can be redacted to maintain privacy and security. This deployment includes a global filter rule that redacts various sensitive headers.
How to Experience This Feature
Use the KFL statement request.headers["Authorization"] to see the Authorization header redacted, among other headers.
Dashboard Mode
Description
Maximize your screen real estate by switching to Dashboard Mode. This effectively eliminates the static top portion of the dashboard, granting additional space for an expansive view of the service map or for monitoring streaming traffic.
How to Experience This Feature

Authorization Rules
Description
Authorization rules determine the access level users have to various features. For instance, they can control the ability to replay traffic, download PCAP files, modify pod targeting rules, and utilize recording and scripting functionalities. For security purposes, all such features are disabled on this demo site.
How to Experience This Feature
Observe the features that are disabled and highlighted by being greyed out.
Summary
We encourage you to deploy Kubeshark in your clusters. Feel free to reach out to us for an in-depth demo to evaluate whether Kubeshark meets your needs and requirements.